Liandri's Links.
Liandri's Links.
Tag cloud
Picture wall
Daily
RSS Feed
Login
Remember me
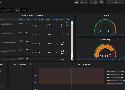
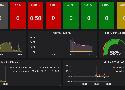
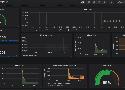
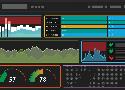
Picture Wall - 10 pics
Deploy traefik, prometheus, grafana, portainer and oauth2_proxy with docker-compose
[Tutoriel] Installer Prometheus/Grafana sans Docker - Zwindler's Reflection
Centraliser les métriques d’une solution VEEAM grâce à Telegraf, InfluxDB et Grafana - My VMworld
Deploy InfluxDB and Grafana on Kubernetes to collect Twitter stats | Opensource.com
How to graph IDRAC temperature, power usage and fan speed measurements in Grafana – Lahilabs
Finding Public Grafana Environments with Google Dorks | Cyberwarzone
Install Glances, InfluxDB and Grafana to Monitor CentOS 7
Setting up Grafana and InfluxDB for UPS monitoring on unRAID | Weylands Techblog
Grafana Series Part 1: Setting up InfluxDB, Grafana and Telegraf with Docker on Linux
homelab/HP_Gen8_Monitor at master · vaxxi/homelab · GitHub
Fold
Fold all
Expand
Expand all
Are you sure you want to delete this link?
Are you sure you want to delete this tag?
The personal, minimalist, super fast, database-free, bookmarking service by the Shaarli community